Geotab: Rapid-Charging EVs Lose Battery Capacity Twice as Fast
Geotab's fleet data puts degradation at up to 3.0% a year for cars that rely on 100kW-plus DC chargers, against 1.5% for AC and lower-power use. The UK's largest used-EV study still finds 95% average health.
Quick answers
- Geotab's 2026 update, covering more than 22,700 EVs, puts average battery degradation at 2.3% a year, up from 1.8% in its 2024 analysis.
- Vehicles using DC fast charging above 100kW degraded by up to 3.0% a year, against around 1.5% for those mainly charging with AC or lower-power options.
- Cars that used DC fast charging for less than 12% of sessions averaged 1.5% a year, while those above 12% averaged 2.5%.
- Generational's UK index of more than 8,000 cars and vans found average State of Health of 95.15%, and a median of 93.53% for 4 to 5-year-old EVs.
- Manufacturer warranty floors, typically 70% over eight years or 100,000 miles, are rarely approached.
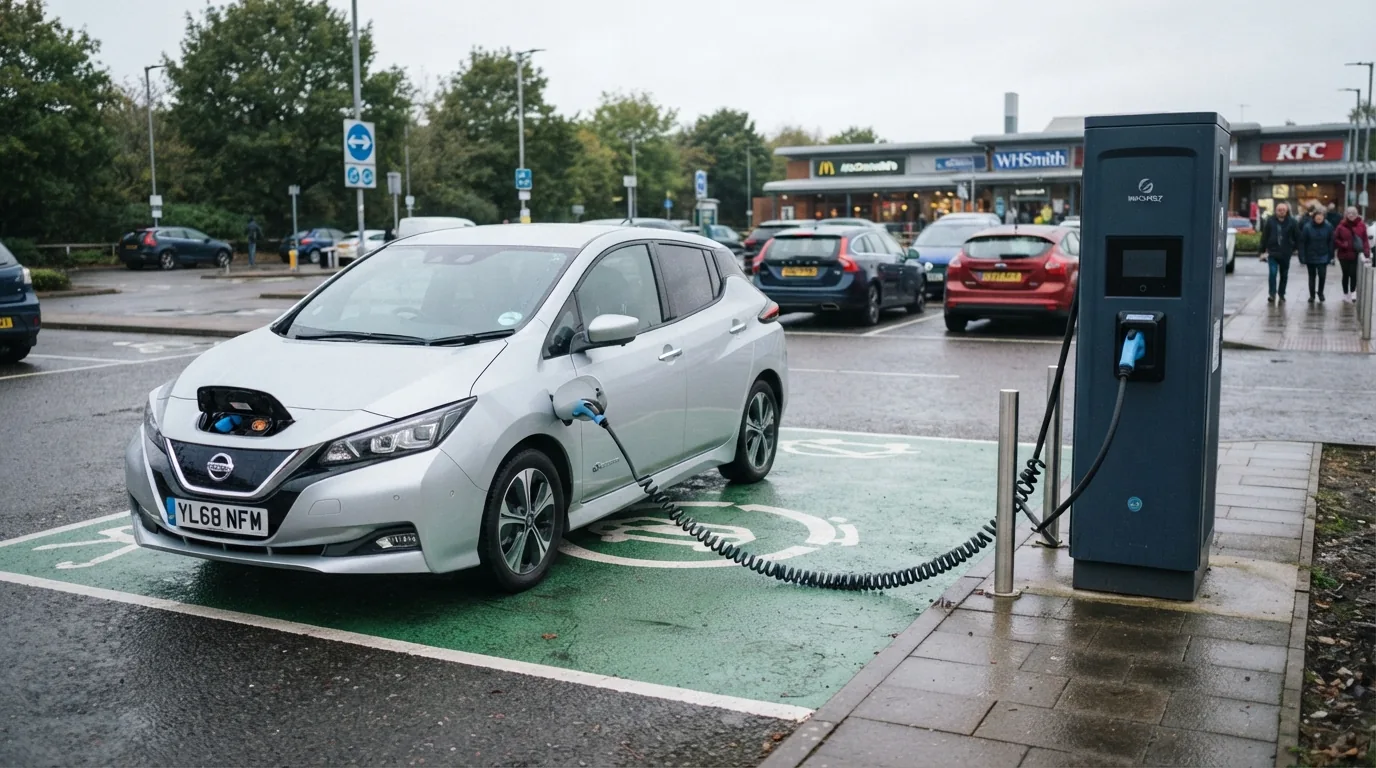
Geotab’s updated fleet data suggests that how you charge matters more than anything else for battery life. Vehicles that mainly used DC fast charging above 100kW degraded by up to 3.0% a year, roughly double the 1.5% of those charging with AC or lower-power options (Geotab). The UK’s largest used-EV study still puts average battery health at 95%, so the result matters most to drivers who have no choice but to rapid charge.
What did Geotab find?
Geotab’s update draws on aggregated data from more than 22,700 electric vehicles across 21 makes and models (FreightWaves). It is fleet telematics data rather than a UK-only sample. Average degradation is now 2.3% a year, against 1.8% in Geotab’s 2024 analysis (Motor Finance Online).
Geotab names charging power as the strongest influence, ahead of climate and usage patterns. Even for heavy rapid-charging use, the average rate is still only 3.0% a year.
| Charging pattern (Geotab) | Average annual degradation |
|---|---|
| Mainly AC or lower-power charging | About 1.5% |
| DC fast charging in under 12% of sessions | 1.5% |
| DC fast charging in over 12% of sessions | 2.5% |
| Mainly DC fast charging above 100kW | Up to 3.0% |
| Fleet average | 2.3% |
Sources: Geotab and Motor Finance Online.
What does UK data say about battery health?
Generational’s 2025 Battery Performance Index tested more than 8,000 UK cars and light commercial vehicles and found average State of Health of 95.15% (Renewable Energy Magazine). Among 4 to 5-year-old vehicles the median was 93.53%.
Older cars show a wider spread. In the 8 to 12-year cohort the median was 85.04%, with the bottom quarter at 82% and the top quarter at 90%. The study also found manufacturer thresholds, typically 70% over eight years or 100,000 miles, are rarely approached (Transport & Energy). Our Aviloo study report reaches a similar conclusion from a separate dataset.
Are the two findings in conflict?
Not really. Geotab measures a rate of loss under different habits, while Generational measures condition at a point in time across mixed use. A simple projection shows the gap: at 2.3% a year, a car loses about 7% over three years, while at 3.0% it loses about 9%. That is our arithmetic, not a forecast from either study, and real loss is not always linear.
For most owners the difference is a few percentage points over a normal ownership period, far from the 70% warranty floor. Our guide to how much degradation is normal on a used EV puts the figures in context.
What does the Geotab data not tell us?
Geotab reports averages, so individual cars will land above and below them. The sources do not break results down by model, battery chemistry or climate in a way we can compare, and the 100kW threshold is a grouping of charging behaviour, not a rule about any single session. Treat the figures as a guide to direction and scale rather than a promise for your car.
What about drivers without a driveway?
This is where the data bites. Drivers who rely on public chargers cannot easily choose slower charging, and cost compounds the problem: rapid charging averaged 77p per kWh in August 2026, according to Zapmap. The slower option is often both gentler on the battery and cheaper.
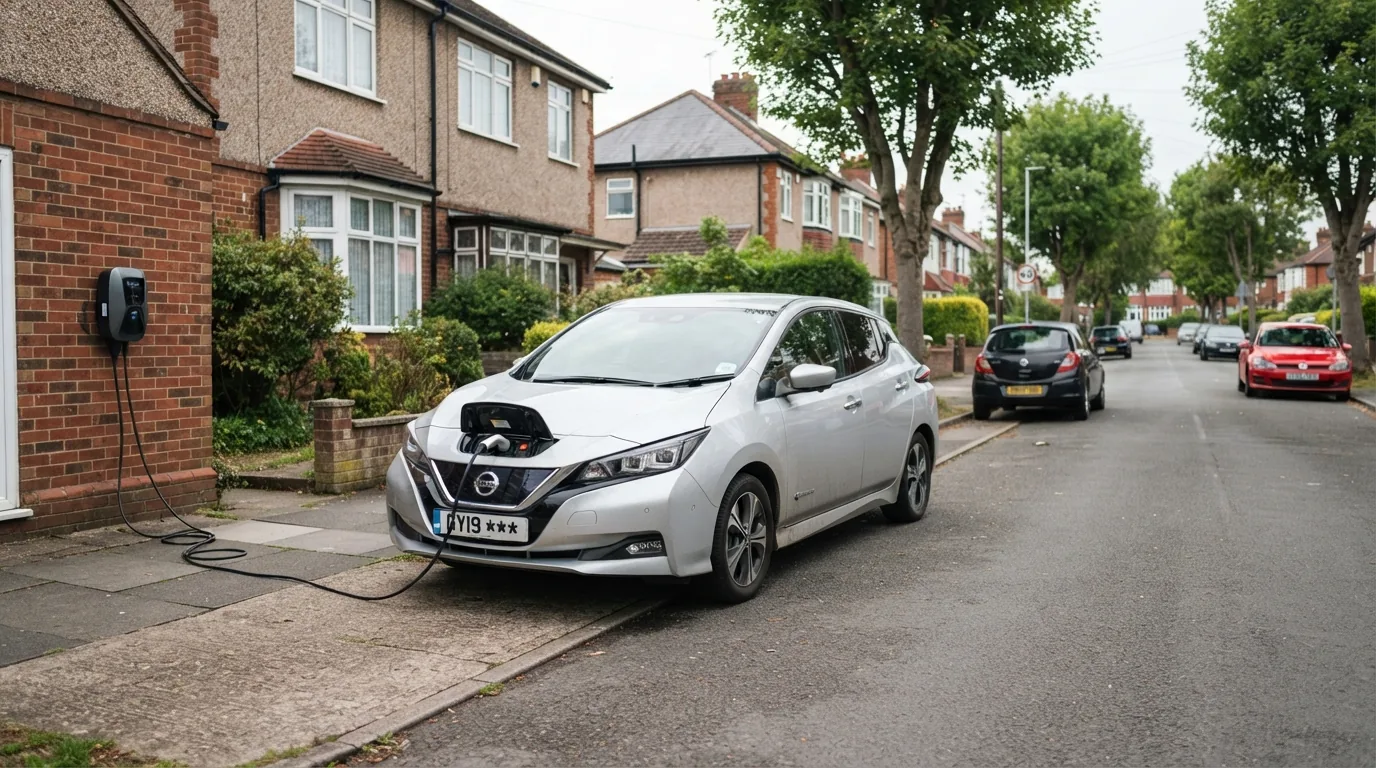
If you lack off-street parking, see how to install a charger without a driveway. Slower public AC charging, where available, avoids the high-power pattern Geotab links to faster wear. Our rapid versus ultra-rapid explainer covers the differences.
Why does high-power charging age batteries faster?
Geotab’s release does not set out a mechanism, so we will not either. What the data shows is the pattern: the more often a car draws high power from DC chargers, the faster its measured capacity falls.
What this means for you
Keep rapid charging for journeys, not routine top-ups. If you can charge from AC most of the time, Geotab’s data suggests you stay near the 1.5% a year end of the range. If you cannot, a rate of up to 3.0% a year is still modest against warranty terms.
When buying used, ask for the battery’s State of Health rather than assuming. Our warranty guide shows what is covered if a battery falls short.
How we test and where our numbers come from
Range figures are official WLTP combined values taken from manufacturer UK specification pages, with real-world estimates drawn from independent comparative testing. Prices are UK list prices at the time of the latest update. Tax, grant and charging-scheme figures come from GOV.UK and HMRC publications. We re-check every guide when pricing, specification or policy changes. Last checked 6 October 2026.
Frequently asked questions
Does rapid charging damage my EV battery?
It wears it faster, according to Geotab. Vehicles using DC fast charging above 100kW degraded by up to 3.0% a year, against around 1.5% for AC or lower-power charging. Even at 3.0%, Geotab describes modern batteries as robust.
How much battery capacity does a typical EV lose each year?
Geotab's 2026 update puts the average at 2.3% a year, up from 1.8% in its 2024 analysis. The UK-specific Generational index found average State of Health of 95.15% across more than 8,000 cars and vans.
How often is too often to use a rapid charger?
Geotab found vehicles using DC fast charging for less than 12% of sessions averaged 1.5% degradation a year, while those above 12% averaged 2.5%. It does not set a safe limit, so treat 12% as a data point, not a rule.
Will rapid charging void my battery warranty?
The sources here do not say it does. Typical warranties promise at least 70% State of Health over eight years or 100,000 miles, and Generational found those thresholds are rarely approached. Check your own warranty terms for charging conditions.
Sources and further reading
- geotab.comGeotabPrimary source referenced in this article.
- electrive.comGeotab analysis: measuring the impact fast charging has on the loss of battery capacityIndependent coverage of the January 2026 Geotab analysis.
- motorfinanceonline.comGeotab data points to modest rise in EV battery degradation as fast charging use growsThe 1.8% 2024 comparison and the 12% DC fast charging session threshold.
- renewableenergymagazine.comUK's largest used-EV battery study reveals 95 percent average battery healthGenerational's 95.15% average across more than 8,000 UK cars and vans.
- transportandenergy.comUsed EV battery performance report highlights degradation not a systemic riskThe Generational findings on age cohorts and warranty thresholds.
- fleetnews.co.ukLargest used-EV study reveals battery degradation ratesFleet-focused coverage of the Generational index.

EV Compared
The EV Compared editorial team tracks the UK electric vehicle market full time: new model launches, list prices, WLTP and real-world range, public charging tariffs and the tax rules that decide what an EV actually costs to run. Every guide is checked against manufacturer specifications and official GOV.UK figures, and updated whenever the numbers move.
Related reading
View all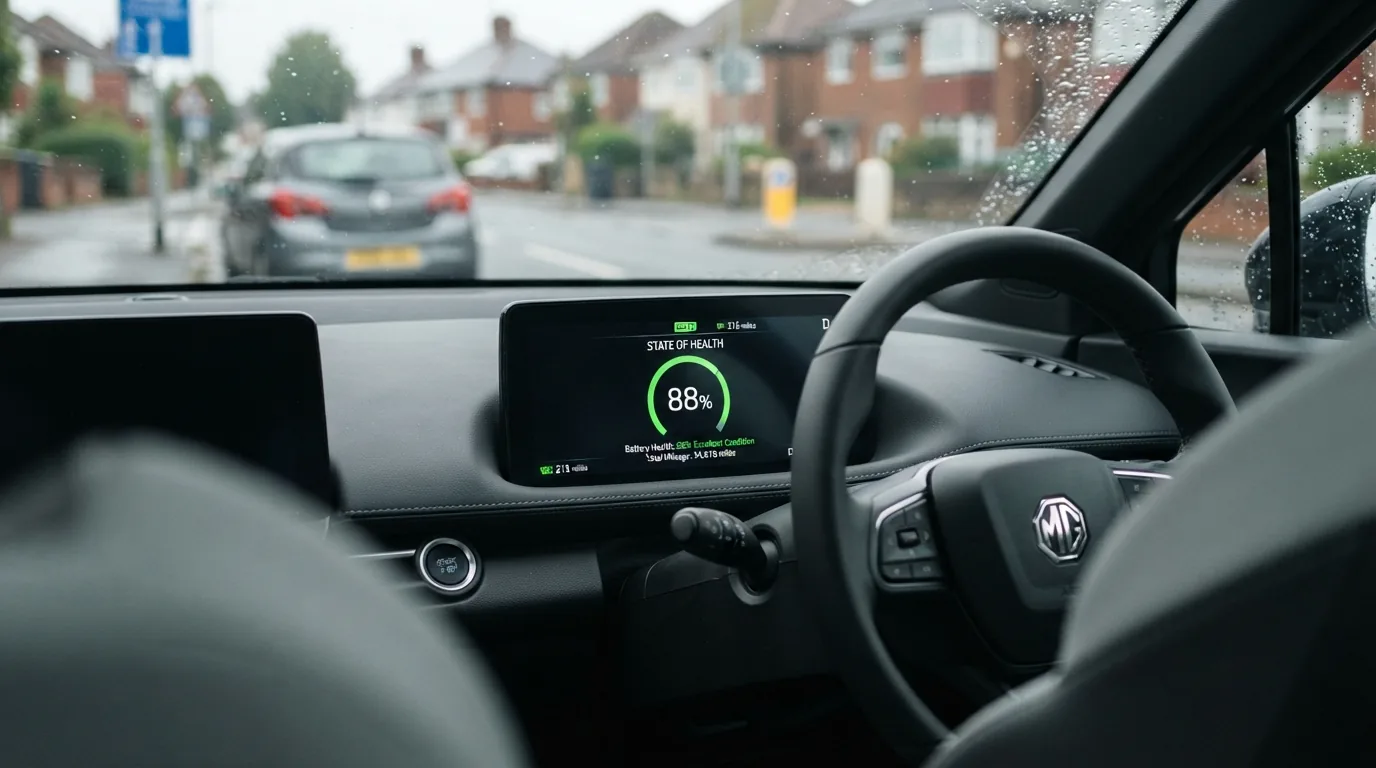
How Much Battery Degradation Is Normal on a Used EV?
The data on EV battery capacity loss is more reassuring than the headlines suggest. Here is what normal degradation actually looks like and when to be concerned

EV Warranties Explained: What UK Buyers Are Actually Covered For
Vehicle warranties, battery warranties, transferability and the gaps you need to know about
Aviloo battery study: EQA 94.0%, Zoe 87.3% at 93,000 miles
A 500,000-test study of 20 popular used EVs puts numbers on battery degradation. 16 of the 20 keep at least 90% at 150,000km, small-pack cars such as the Renault Zoe trail, and Aviloo now offers a UK used battery warranty.
How Long Do Electric Car Batteries Last? A UK Owner's Guide
Real-world degradation data, warranty terms and what to expect over 10-plus years of ownership
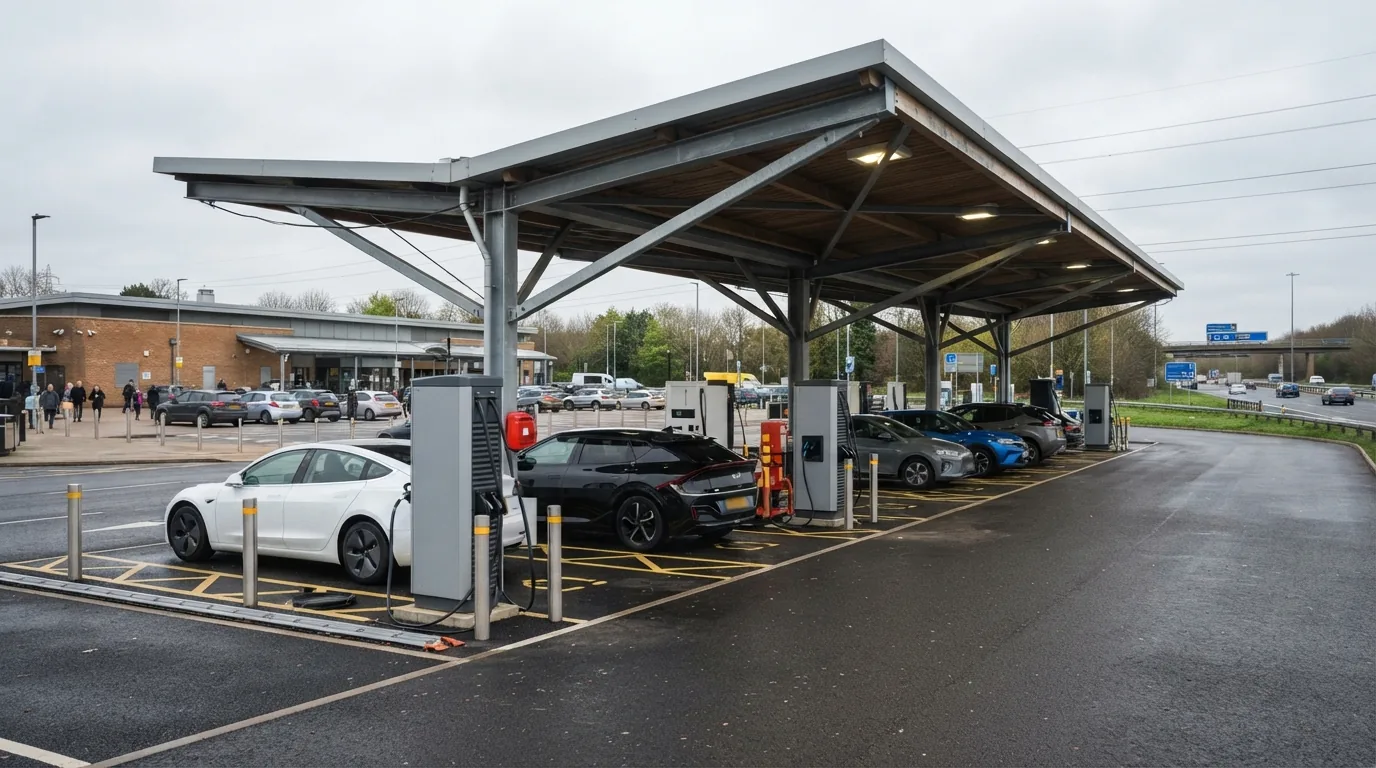
Rapid vs Ultra Rapid Charging: What Is the Difference?
A plain-English guide to the kW bands, real charging times, costs and what each tier means for your EV
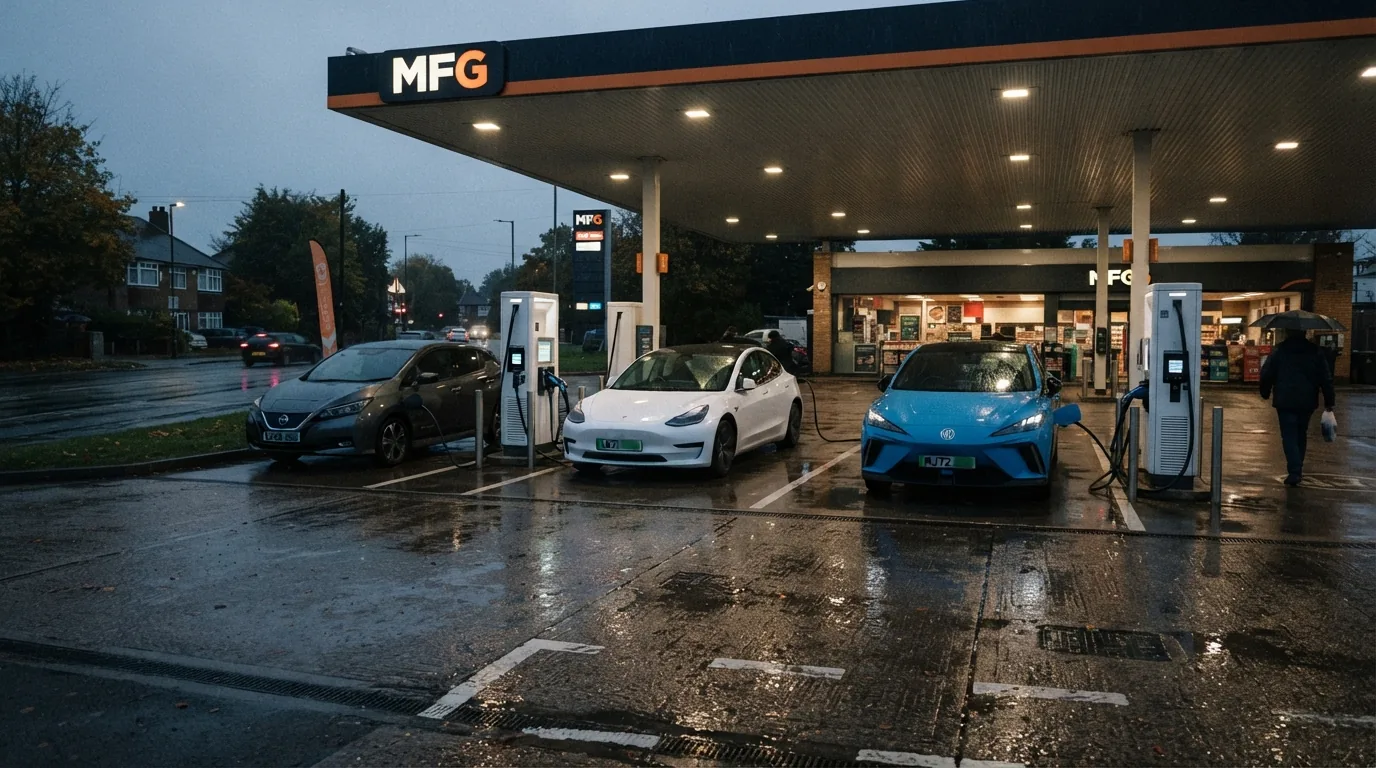
Zapmap: rapid charging averages 77p/kWh as MFG keeps 59p app price
Rapid public charging averaged 77p/kWh in August, and MFG has kept its 59p summer price for drivers who use its app. Here is what the big networks charge, and the off-peak and subscription deals that cut the bill.